How to Track NFC Business Card Views, Link Taps, and Conversions (Without CRM Complexity) no reader test
You can track NFC business card performance without complex CRM software. All you need is a few key metrics and basic spreadsheet math.
- Profile views
- Links taps
- New connections
- Simple export reports
- Basic spreadsheet math
This guide shows how to measure NFC business card taps, visits, and conversions using a clear workflow suitable for freelancers, SMEs, exhibitors, and small sales teams.
Key NFC Business Card Metrics Defined
View
A 'view' is recorded when someone opens your profile page in their browser after tapping your NFC card or scanning a QR code.
Links Taps
A 'links tap' is when someone clicks a button or link inside your profile (e.g., call, email, WhatsApp, or website buttons). Indicates engagement.
- Call button
- Email button
- WhatsApp link
- Website link
New Connections
Represents contacts or details captured via your profile. Closest metric to counting qualified leads.
Tap Through Rate
Percent of profile views that result in a link tap.
Tap Through Rate = (Links Taps ÷ Views) × 100
Conversion (General Term)
Any meaningful action after a profile view (e.g., contact saved or direct contact initiated). Measured through links taps or new connections.
How NFC Tracking Works
1. The NFC chip contains a URL.
2. A user taps the card.
3. The browser opens your profile page.
4. An analytics tool records the page view.
5. If the user acts (click/link), that action is logged.
Tracking is done at the web page level, not inside the NFC chip.

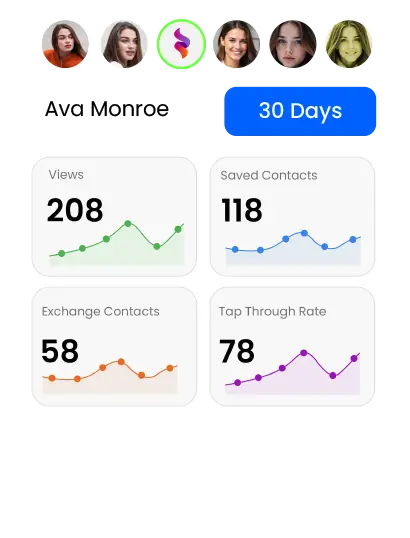
The eylet Team Dashboard provides real-time metrics on profile engagement and link performance.
Metrics & Definitions Table
| Metric | What It Means | Why It Matters |
|---|---|---|
| Views | Profile page loads | Shows how many people opened your profile |
| Links Taps | Clicks on buttons or links inside the profile | Measures engagement beyond viewing |
| New Connections | Captured or saved contact details | Represents qualified leads |
| CTR (Tap Through Rate) | Percentage of views that result in link interaction | Shows how effectively your profile turns views into clicks |
Example: Calculating Conversion Rate and ROI
Basic Conversion Rate
- You exported lead data showing:
- Views: 200
- Link Taps: 58
- New Connections: 30
Conversion Rate = (New Connections ÷ Views) × 100
30 ÷ 200 = 0.15 → 0.15 × 100 = 15% conversion rate
Common Tracking Mistakes (and Fixes)
Confusing views with conversions: Fix: Track views separately from links taps and new connections.
Ignoring repeat views: Fix: One person visiting multiple times counts as one lead. New connections estimate unique leads.
Not optimizing profile layout: Fix: Reduce clutter. Use a clear call-to-action for higher conversions.
No follow-up tracking: Fix: Add a 'Status' column to your spreadsheet (e.g., Contacted / Closed / Lost).
Frequently Asked Questions
How do NFC business card analytics work?
Analytics tools record profile views and actions when someone taps your NFC card or scans a QR code.
Can I track NFC taps?
You can track profile views and engagement via the profile page; the chip itself just opens a URL.
What is the difference between tap and view?
Tap is the physical action with the card; view is the browser page load.
Can digital business cards show engagement data?
Yes. Most platforms provide dashboards with profile views, link taps, and sometimes leads.
Do I need a CRM to measure conversions?
No. Export leads and calculate conversion rates manually using spreadsheets.
How do I improve the NFC conversion rate?
Make profiles clear, add calls-to-action, reduce clutter, and follow up quickly.
Final Thoughts
You can track NFC business card performance with clear metric definitions, consistent exports, simple math, and regular review—no enterprise software required. Most small teams benefit more from simple, clear measurement than from automation. Review your provider's documentation for analytics features, and pick simplicity for the best results.