You can track NFC business card performance without complex CRM software. All you need is:
- Profile views
- Links taps
- New connections
- Simple export reports
- Basic spreadsheet math
This guide explains exactly how to measure taps, visits, and conversions in a clear workflow that works for freelancers, SMEs, exhibitors, and small sales teams.
What Do “Views,” “Links Taps,” and “Conversions” Actually Mean?
Many people use different terms when talking about NFC tracking. In eylet, the dashboard uses specific metrics. Here is what they mean.
View
A view is recorded when someone opens your profile page in their browser. This usually happens after an NFC tap or QR scan. It represents a profile page load.
Links Taps
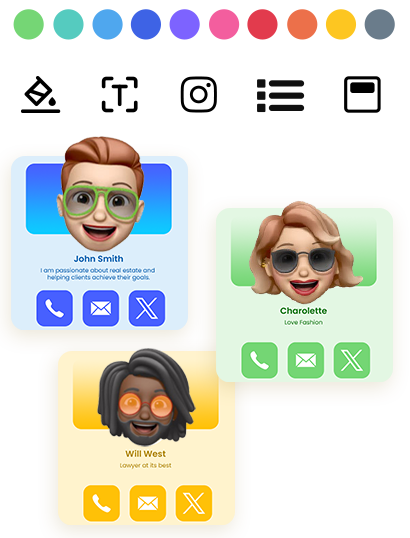
Links taps are recorded when someone clicks on a button or link inside your profile. For example:
- Call button
- Email button
- WhatsApp link
- Website link
This metric shows engagement beyond simply viewing your profile.
New Connections
New connections represent contacts captured or saved through your profile. This is typically the closest metric to a qualified lead.
Tap Through Rate
Tap Through Rate measures the percentage of profile views that result in link interaction.
Tap Through Rate = (Links Taps ÷ Views) × 100
Conversion (General Term)
A conversion is a broader performance concept. It usually refers to any meaningful action taken after someone views your profile, such as saving contact details or initiating direct communication.
In practical terms, conversions are reflected through metrics like Links Taps and New Connections.
How NFC Tracking Works (Simple Flow)
Here is what happens technically:
- The NFC chip contains a URL.
- A user taps the card.
- The browser opens your profile page.
- An analytics tool records the page view.
- If the user takes action, that action is logged.
Tracking occurs at the URL and page levels, not within the NFC chip itself.
Metrics You Can Track
Here are the core digital business card tracking metrics:
- Views
- Links taps
- New connections
- Tap Through Rate
- Individual member insights
- Team-level lead reports
Most digital business card analytics dashboards show at least page views and link clicks.
If you are using eylet, you can access your leads from the main manage teams dashboard by tapping the “Leads” section. Managers can view global leads, filter by team or individual members, and download reports directly.
Tap the Download button to export your leads as an Excel file. On the desktop, the file downloads immediately. If downloaded from a mobile device, the Excel file is sent to the manager’s email as an attachment.

The eylet Team Dashboard provides real-time metrics on profile engagement and link performance.
Metrics & Definitions Table
| Metric | What It Means | Why It Matters |
|---|---|---|
| Views | Profile page loads | Shows how many people opened your profile |
| Links Taps | Clicks on buttons or links inside the profile | Measures engagement beyond viewing |
| New Connections | Captured or saved contact details | Represents qualified leads |
| CTR (Tap Through Rate) | Percentage of views that result in link interaction | Shows how effectively your profile turns views into clicks |
Step-by-Step: How to Track Conversions Without CRM
You do not need Salesforce to measure performance. Here is the simple workflow.
Step 1: Export Your Leads
Download your lead-capture data as a spreadsheet (CSV or Excel).
In eylet Teams, managers can download leads using the Download button from the Leads section.
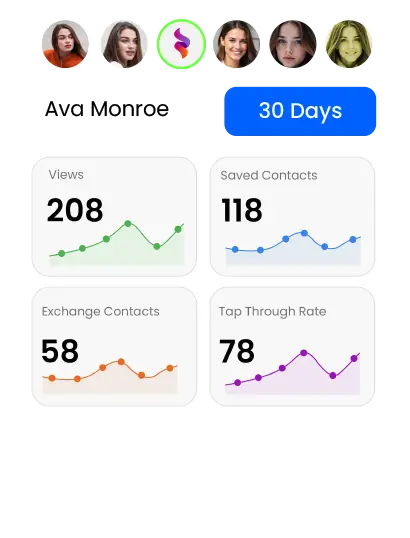
Step 2: Record Your View and Action Numbers
From your analytics dashboard, note:
- Total views
- Total links taps
- Total new connections
Example:
- 200 views
- 58 link taps
- 30 new connections
Step 3: Calculate Conversion Rate
Use this formula:
Conversion Rate = (New Connections ÷ Views) × 100
In our example:
- 30 ÷ 200 = 0.15
- 0.15 × 100 = 15% conversion rate
Now you know how effective your profile is.
How to Calculate ROI from NFC Cards
Let’s use a simple scenario.
You attend an exhibition:
- 300 views
- 75 link taps
- 40 new connections
- 5 closed deals
- Average deal value = $800
In this case, new connections represent captured leads, and closed deals represent converted customers.
Revenue generated: 5 × 800 = $4,000
If your NFC setup costs $100:
ROI = (Revenue − Cost) ÷ Cost
ROI = (4000 − 100) ÷ 100
ROI = 39
Multiply by 100 to express as a percentage:
39 × 100 = 3900% ROI
This shows how a small networking investment can generate measurable business returns.
When CRM Integration Actually Makes Sense
CRM becomes useful if:
- You have multiple sales reps
- Leads must auto-assign
- You require pipeline automation
- You run enterprise reporting dashboards
For freelancers, exhibitors, real estate agents, and SMEs, exporting once per week into Excel is usually enough.
Complex systems create friction. Simple tracking creates clarity.
Common Tracking Mistakes (And How to Fix Them)
Mistake 1: Confusing views with conversions
Fix: Track views (opens) separately from actions like links taps and new connections.
Mistake 2: Ignoring repeat views
Fix: One person opening your profile three times is not three leads. Use new connections to estimate the number of qualified leads.
Mistake 3: Not optimizing profile layout
Fix: Reduce clutter. A clear call-to-action increases conversion.
Mistake 4: No follow-up tracking
Fix: Add a “Status” column in your spreadsheet (Contacted / Closed / Lost).
Who This Workflow Is Best For
This simple non-CRM tracking system works best for:
- Freelancers
- Exhibitors
- Real estate agents
- Consultants
- Local service businesses
- Small sales teams
Choose this workflow if:
- You want clarity, not complexity
- You prefer spreadsheet control
- You capture under 500 leads per month
- You don’t need automated sales pipelines
- You value predictable processes
Enterprise teams may benefit from CRM automation, but most small teams do not require it.
Frequently Asked Questions
How do NFC business card analytics work?
They track profile views through the URL that opens when someone taps your card or scans a QR code. Analytics tools record page loads and actions.
Can I track NFC taps?
You can track profile views and engagement through the hosted profile page. The NFC chip only triggers the URL.
What is the difference between tap and view?
Tap is a physical interaction. View is the browser page load.
Can digital business cards show engagement data?
Yes. Most platforms provide analytics dashboards that show profile views, link taps, and sometimes lead captures.
Do I need a CRM to measure conversions?
No. You can export leads and calculate conversion rates manually using simple formulas.
How do I improve the NFC conversion rate?
Improve profile clarity, add strong call-to-action buttons, reduce clutter, and follow up quickly.
Final Thoughts
Tracking NFC business card performance does not require enterprise software. You need:
- Clear metric definitions
- Consistent exports
- Simple math
- Regular review
That’s it.
Complex CRM systems are useful at scale, but most professionals benefit more from clear measurement than automation.
If you want structured analytics, export control, and dashboard visibility, review the official documentation of your chosen provider and verify analytics capabilities directly.
For SMEs and small teams, simplicity wins.